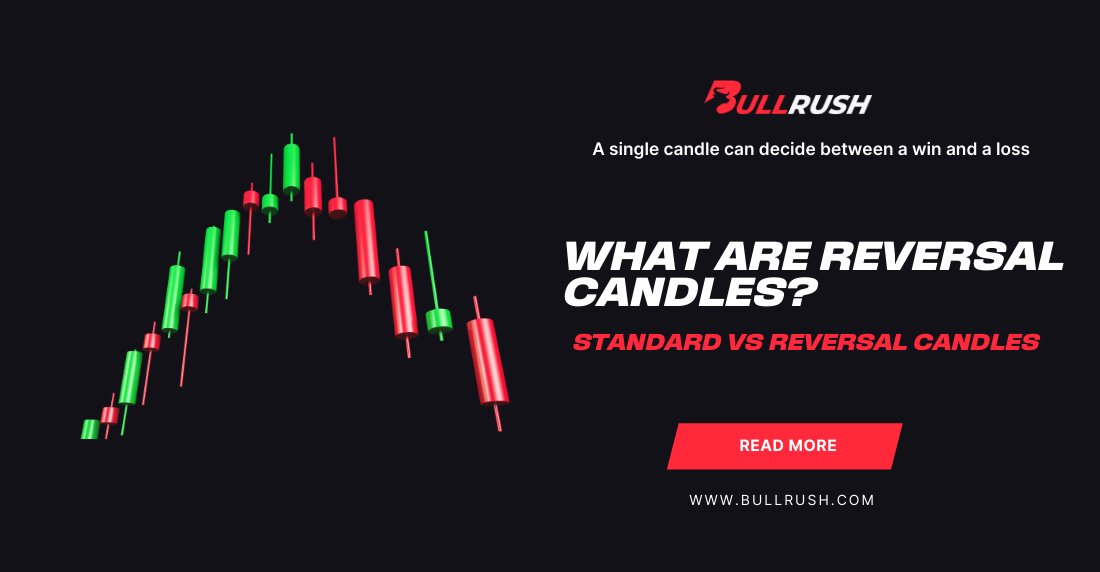
What Are Reversal Candles? Standard vs Reversal Candles
Markets speak in candles. Each bar is a sentence, each pattern a plot twist. The problem? Most traders stare at candles like wallpaper; pretty shapes, no story. That’s why they miss the real message: who’s in control and when that control is about to shift.
Standard candles are the quiet confirmations, the market’s way of saying, “trend intact, keep going.” Reversal candles, on the other hand, are the shock headlines: the sudden shift in tone that warns you a turning point might be near. Learn to read the difference, and you stop guessing and start trading with intent.
If you’ve ever wondered whether a single candle could be the difference between riding a winner or eating a loss, this is the playbook you’ve been missing.
What Is a Reversal Candle?
A reversal candle is like an exclamation mark at a plot twist. It signals that the balance between buyers and sellers just shifted. Classic examples include the hammer, shooting star, engulfing patterns, and certain doji formations. Key features are an unusually long wick (shadow), a relatively small body, or a full-body engulfment of the previous candle, and crucially, their location: at swing highs/lows, near support/resistance, or at the end of a strong move.
But a single reversal-shaped candle by itself is a nervous whisper, not a guarantee. The real power comes from context: volume, location relative to key structure, and what the next candle does. A reversal candle at a key resistance with rising volume and follow-through in the next candle gives a much stronger signal than an isolated hammer stuck in the middle of a range.
Tip: Look for reversal candles at important price levels; the candle’s location tells more of the story than the shape alone.
Sum up:
- Reversal candles hint at a shift in control between buyers and sellers.
- Examples: hammer, shooting star, bullish/bearish engulfing, doji.
- Always read reversal candles in context (volume, structure, timeframe).
What Is a Standard Candle?
A standard candle is the market’s ordinary sentence: it tells you the trend continued without drama. On a bullish standard candle, the close sits well above the open, and the body is relatively solid compared with recent candles. On bearish standard candles, you’ll see a solid body closing below the open. These candles are often confirmation that the current directional bias (trend) is still in control.
Standard candles become more reliable when they appear in the direction of the prevailing trend and follow a logical price structure. For example, after a pullback toward a moving average or a support level. Think of them as the market saying, “Yep, the plan stays the same.” They rarely make bold proclamations; they simply validate the existing idea.
Tip: Use standard candles to add to a winning position or to time entries on a pullback, but only in the trend’s direction.
Sum up:
- Standard candles have solid bodies and confirm existing trend direction.
- They work best after pullbacks or at trend continuation points.
- Treat them as validation, not prediction.
Anatomy & Psychology Behind Candles
Every candle encodes a short negotiation: the open, the battle, and the verdict at the close. The wick shows the market’s attempt to push the price one way before being rejected, and the body shows who ultimately won the session. Longer bodies mean decisive wins; long wicks show rejection. Watching relative candle size (compared to recent bars) tells you whether today’s move is a murmur or a roar.
Psychology is the hidden layer: a long wick off a swing high means traders tried to push higher, but sellers fought back; fear crept in. A long-bodied green candle in an uptrend shows confidence: buyers arrived together and closed the gap. Learning the psychology behind shapes helps you predict what the next candle might try to do. But remember, it’s probability, not prophecy.
Tip: Compare a candidate candle to the last 5–10 candles on that timeframe: size and placement give context faster than any indicator.
Sum up:
- Wick = rejection attempts; body = who won the session.
- Relative size shows conviction vs. indecision.
- Candle reading is reading crowd behavior, always probabilistic.
Trend-Following with Standard Candles
In a trending market, standard candles are your allies. Look for pullbacks into structure (moving average, previous support, trendline) and wait for a clean standard candle in the trend’s direction to signal a lower-risk entry. This approach minimizes guesswork: you’re trading with the crowd rather than against it, adding when the market reconfirms the trend.
Timeframe matching matters: a strong standard candle on the 1-hour chart is not the same signal as one on the 1-minute chart. Higher-timeframe standard candles carry more weight because they compress more trading sessions into a single bar. Use them to identify momentum resumption and manage position size accordingly.
Tip: Prefer entries when a standard candle closes beyond the pullback high/low. That close often reduces false starts.
Sum up:
- Use standard candles to join and add to trends after pullbacks.
- Higher-timeframe standard candles are stronger signals.
- Wait for a decisive close to avoid whipsaws.
Trading Reversal Candles: Where to Be Cautious
Reversal candles can flag turning points, but they also attract false signals: traders love to see patterns, and the market sometimes spoils the party. Always require confirmation: a follow-through candle in the reversal direction, increased volume, or alignment with divergence on an oscillator. Without confirmation, a reversal candle is a tempting but risky pin.
Position sizing and stop placement are critical around reversals because you’re picking against recent momentum. Place stops beyond the wick extremes or beyond a nearby structural level, and size the trade so a single stop doesn’t damage your account. Aim for clear risk-reward ratios; reversals often need patience for the move to materialize.
Tip: Confirm reversal candles with either price follow-through or a multi-timeframe check. Never trade a lone candle on a thin timeframe.
Sum up:
- Require confirmation before trading reversals.
- Use tight, logical stops beyond wick extremes or structure.
- Manage size: pick smaller when you’re fighting momentum.
Confirmation, Filters & Risk Management
Candles are powerful, but they become surgical only when paired with filters: trend context, volume, support/resistance, and occasionally a clean oscillator signal like RSI divergence. A reversal candle backed by volume and occurring at a structural level turns a coin flip into a calculated wager. Multi-timeframe confirmation, seeing the same sentiment on a higher timeframe, adds odds in your favor.
Risk management is non-negotiable. Use stop placement tied to price structure (wicks, swing points), pick position size by percent risk or ATR-based distances, and ensure your risk-reward profile matches the trade idea. The best candle read in the world can’t overwrite poor risk management.
Tip: Use average true range (ATR) to size stops and avoid arbitrary dollar-distance stops that ignore volatility.
Sum up:
- Use volume, structure, and higher-timeframe checks as filters.
- Size positions with ATR or percent risk; place stops beyond structure.
- Candle signals + disciplined risk management = repeatable trading.
Nail the Candle, Win the Race
Candles are compact stories about market participants. Standard candles keep the narrative moving forward; reversal candles signal a possible plot twist. The difference between a profitable trader and one who only hopes is learning to read the nuance: placement, follow-through, and risk controls. Practice the rules until they feel mechanical, then sharpen them with edge-seeking tweaks.
Ready to turn reading into doing? BullRush offers an arena to practice. Enter live competitions that run on demo trading accounts and test candle-based setups against other traders; perfect for validating ideas under pressure and building the muscle memory real markets demand.
Want a safe test bed? Sign up at BullRush and join a competition today. Or visit BullRush Academy and focus on mastering candlestick basics with free courses.
Trade, compete, and turn candle theory into real results.
FAQs
Q: Are candle patterns reliable?
They’re probabilistic signals; reliable when combined with context and confirmation, unreliable when read in isolation.
Q: Which timeframe is best for candles?
Depends on your trading style. Scalpers use 1–5 minute, swing traders use 4-hour to daily. Higher timeframe candles carry more weight; lower timeframe candles need tighter filters.
Q: How big should my stop be around a reversal candle?
Use structure: typically just beyond the wick/swing. Size the position so that stop loss equals a small fixed percent of equity or matches the ATR-based distance.
Q: Can I use indicators with candle reading?
Yes, use indicators as filters, not crutches. Volume, moving averages, and RSI divergence work especially well.


