

How to Get Really Good at Trading Competitions
Day Trading competitions and trading tournaments offer a unique opportunity for traders to showcase their skills, test their strategies, and compete against fellow traders in a challenging environment.
While winning trading competitions for cash and even funded accounts are great motivators, participants can also gain valuable experience, improve their decision-making abilities and have a hell of a good time.
Whether you are a ‘rookie’ trader looking to learn from seasoned professionals or an experienced trader seeking to sharpen your skills, signing up for a trading contest can provide you with a platform to grow and excel in the world of trading.
So, get ready to elevate your trading game by exploring the tips shared below and taking your trading journey to new heights.
Inside The Article
Truly Understanding the Rules and Regulations
I know you hate reading rule books, but in the case of trading competitions, rules and regulations can actually make or break your performance.
You want to pay close attention to the terms of each competition because they inform not only what you can (and cannot) do but also your STRATEGY.
Most trading competitions have specific restrictions on losses you can sustain during the competition. They also spell out what is the criteria for winning and other parameters.
Some of the most common ‘rules’ you might find in trading competitions:
DRAWDOWN LIMIT
Drawdown refers to how much your trading account is down from its starting balance.
Imagine you start with $10,000 in a trading competition, and at some point, your account value goes down to $7,000 before it starts rising again. Your drawdown in this case is 30% because you lost 30% of your accounts starting balance.
Most trading competitions will have a Drawdown Limit, which if reached will disqualify you from the competition. The lower the DL, the harder the competition standards.
STOP-LOSS
In the context of trading contests, as well as in general trading practices, a stop-loss is a predetermined level of loss at which a trade is automatically closed. This is a risk management tool used by traders to prevent larger losses in their trading activities, including during trading contests.
The definition of a stop-loss in trading contests does not significantly differ from its use in regular trading. It is set as an order to sell (or buy, in the case of a short position) once the price of an asset reaches a specific point. The primary aim of a stop-loss order is to limit an trader’s loss on a position.
For example, if a participant in a trading contest buys EURUSD at 1.07, they might set a stop-loss order at $1.06. This means if EURUSD price falls to 1.06, the stop-loss order gets triggered, automatically selling the EURUSD at the next best available price, thereby capping the trader’s loss.
In trading contests, where participants might be more inclined to take risks to achieve higher rankings or returns, a stop-loss serves as a crucial tool to manage and mitigate the risk of significant losses. The specific rules or parameters for setting stop-losses can vary from one contest to another, depending on the contest’s rules set by the organizers. Additionally, some trading competitions require every trade to be placed with a stop-loss attached.
POSITION SIZING
Position sizing in trading contests refers to the strategy of determining the amount of capital to allocate to each trade.
It’s crucial for managing risk and maximizing returns within a contest’s parameters. Participants decide on the size of their trades based on their risk tolerance, trading strategy, and the contest rules, aiming to optimize their performance against competitors.
Effective position sizing can balance the pursuit of high returns with the need to limit losses, impacting the trader’s standing in the contest.
MINIMUM DAYS TRADING
Simply the minimum number of days you need to trade in order to continue participating. If at the end of a competition you have not met your minimum trading days, you will be disqualified and not eligible for a prize.
ALGO TRADING RULES
Algo trading, short for algorithmic trading, involves using computer programs to trade according to predefined criteria and rules, without human intervention. This approach can be particularly appealing for trading competitions, where speed and precision are crucial.
Algorithm Basics: At its core, an algorithm is a set of instructions for solving a problem or accomplishing a task. In trading, this might mean instructions to buy or sell based on specific market conditions.
Trading Strategy: This is the logic your algorithm will follow. It might be based on technical analysis (like moving averages), fundamental analysis (like earnings reports), or a combination of factors.
TRADING INSTRUMENTS
In the context of trading contests, “trading instruments” refer to the various types of financial assets that participants are allowed to trade.
These can include stocks, bonds, currencies (forex), commodities, derivatives (such as options and futures), and other financial securities. The most commonly tradable assets during a competition are Forex, Indices and Crypto.
The specific instruments available for trading in a contest depend on the rules set by the organizers, which aim to simulate real-world trading conditions or focus on specific markets or strategies.
TRADING HOURS
In trading contests, “trading hours” typically refer to the specific time frame during which participants can execute trades within the competition. The trading time frame for the start and finish of the competition is predefined, and announced by the contest organizer. The specific product time frames are dictated by the trading market hours.
The definition ensures fairness and uniformity, so all participants trade under similar conditions and have equal opportunities to demonstrate their skills and strategies.
WINNING CRITERIA
In trading contests, the winning criteria often revolves around achieving the highest percentage return on investment (ROI) within a specified period.
Participants are judged based on their ability to grow their initial capital more than their competitors, using various trading strategies. The exact criteria can vary, including factors like consistency of performance, risk management, or adherence to specific rules set by the contest organizers.
The aim is to identify traders who can generate the most profit effectively and efficiently under the contest’s conditions.
By familiarizing yourself with these guidelines, you can avoid any potential misunderstandings or disqualifications, allowing you to focus on showcasing your trading skills and strategies effectively.
So, before diving into the contest, take the time to carefully review and understand the rules and regulations to maximize your chances of success and make the most out of this valuable learning opportunity.
Developing a Winning Trading Strategy
Creating a winning strategy for trading CFDs (Contracts for Differences) like Forex, Indices, and Crypto requires a careful blend of risk management, market analysis, and discipline. Here’s a strategy framework you could consider:
Solid Market Research
Conducting effective market research for trading CFDs like Forex, Indices, and Crypto within a trading contest involves several steps. The aim is to gather relevant information to make informed decisions, manage risks, and capitalize on market movements.
Let’s start by understanding the instruments most commonly traded in competitions:
Forex: Volatility is often driven by economic indicators, interest rate decisions, and geopolitical events. Understanding these can give you an edge.
Indices: Economic health of the region the index represents affects its movement. Earnings reports and significant economic data releases are critical.
Crypto: Highly volatile and influenced by market sentiment, regulatory news, and adoption by mainstream finance.
You can use a variety of research tools like economic calendars, technical analysis software, newsletters and publications, social media forums like Discord channels and more.
While tools and techniques are important, gauging ‘market sentiment’ can be a powerful tool to predict how the market will behave in the short term. High levels of fear or greed in the market can indicate potential reversals or continuations of trends.
Analyzing trading volume and open interest is also another way to strengthen your moves. If you are ready to start your market research, follow the guidelines in this article.
Risk Management Techniques
A fundamental aspect of succeeding in a Trading Challenge or Competition is showcasing proficient risk management skills.
Traders must exhibit an ability to mitigate losses by adhering to precise position sizing guidelines. This disciplined approach to risk management not only safeguards your ‘capital’ but also underscores a trader’s capability to navigate volatile market conditions while preserving their profitability potential.
It’s a cornerstone of successful trading. Quick steps to implement risk management:
Set a Risk-Reward Ratio: Aim for a risk-reward ratio of at least 1:3, meaning for every dollar risked, you aim to make three.
Limit Losses: Use stop-loss orders to limit losses to a small fraction of your account on any single trade. Considering the 20% drawdown limit, it’s prudent to risk no more than 1-2% of your total account balance on a single trade.
Leverage Carefully: While leverage can magnify profits in CFD trading, it can also amplify losses. Use it judiciously.
A well thought-out strategy is the single most important weapon in your trading arsenal. We are detailing more about setting up trading strategies here.
Practicing with Demo Trading Platforms
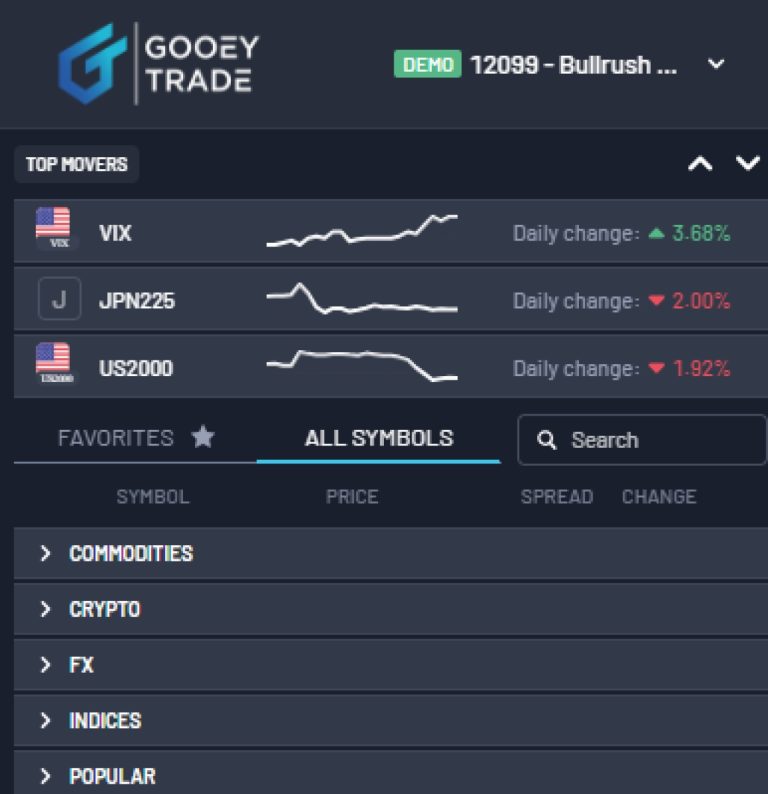
Trading Platforms: Use platforms that offer real-time data, advanced charting tools, and fast execution.
Demo Account: Before starting the contest, practice your strategy in a demo account to ensure it’s viable without risking real money.
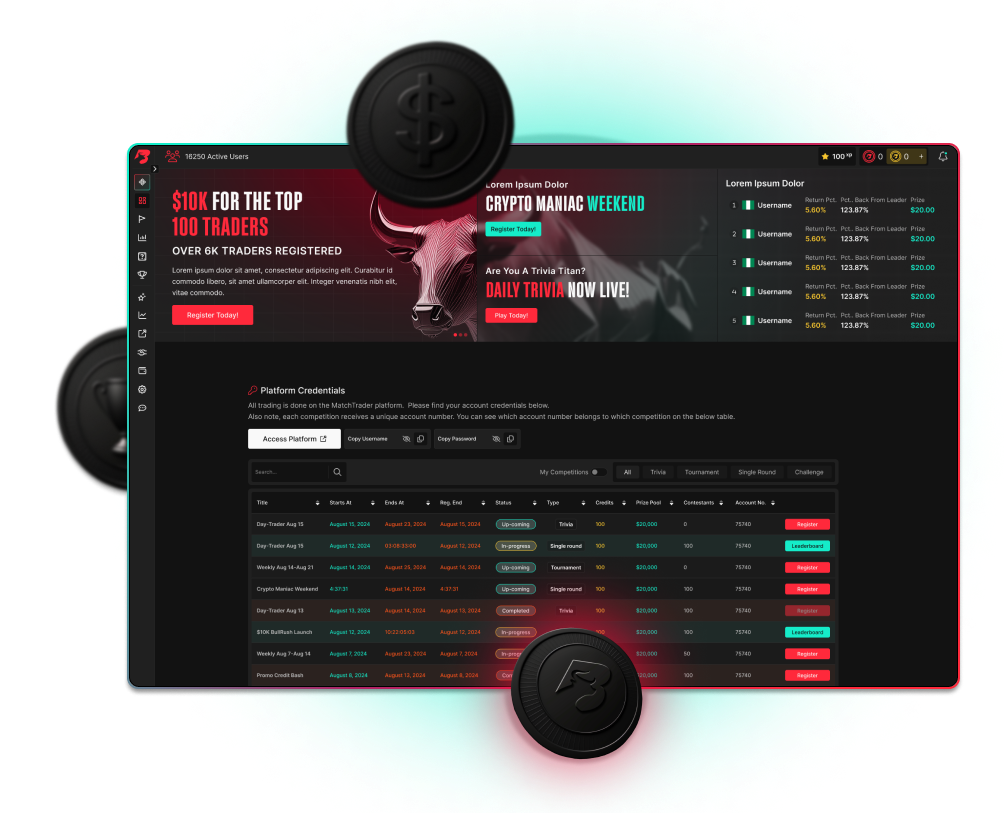
Practice is your best friend here. Using a demo account is invaluable. It’s like having a sandbox where you can experiment with your analyses and strategies without the fear of losing money. Applying what you’ve learned to real market data regularly is key. It’s one thing to understand a concept in theory, and another to see it play out in real time. This hands-on approach helps refine your predictions and strategies. Testing different trading techniques and refining your approach in a simulated trading environment will help you build the skills and confidence to trade in the ‘real world’. How about winning prizes while you hone in your trading skills? Join BULLRUSH and start competing today! You can join for free on the Trading Dashboard.Enhancing Your Technical Analysis Skills
When it comes to honing your technical analysis skills, think of it as embarking on a personal development journey. It’s not just about mastering charts and indicators; it’s about developing a deep understanding of market behaviors and learning to anticipate future movements.
Starting with the basics is like building a foundation for a house. You want to make sure you’re well-versed in:
reading different types of charts
understanding trends
and grasping how volume affects the market.
Then, you dive deeper into the world of technical indicators and chart patterns. It’s fascinating to see how tools like Moving Averages, RSI, and MACD, or patterns like head and shoulders, can almost act like a window into the market’s soul, giving you hints about where things might be heading.
Following experienced traders and participating in webinars or workshops can be incredibly enlightening. You’ll pick up on nuances and strategies that only come with experience.
Also, don’t hesitate to specialize in a particular market at first, but also keep an open mind about diversifying your expertise. And consider exploring different time frames; it’s intriguing how the dynamics can shift from a short-term to a longer-term perspective.
Embracing technology will also give you an edge. Advanced charting software offers a plethora of tools at your fingertips, and becoming proficient in using these tools can significantly enhance your analysis. Automated analysis tools, while not a substitute for your own analysis, can complement your efforts and provide additional perspectives.
Enhancing your technical analysis skills is much like any other skill in life. It requires dedication, continuous learning, and an openness to adapt and evolve. It’s a journey that’s both challenging and rewarding, offering the potential to not just improve your trading outcomes, but to also gain a deeper understanding of the complex world of financial markets.
Learning Chart Patterns
In the realm of trading CFDs like Forex, indices, and crypto, especially within a short time frame like a contest, becoming familiar with chart patterns is akin to learning a new language. This language allows traders to interpret market sentiment and predict potential future movements.
Let’s talk about some of the most used chart patterns and decode what they typically signify
Head and Shoulders
Imagine a person’s silhouette with two shoulders and a head. This pattern forms when a price peak (shoulder), followed by a higher peak (head), and then another lower peak (shoulder) occurs. In its standard form, it signals a reversal of an uptrend into a downtrend. Conversely, the inverse head and shoulders pattern indicates a potential reversal from a downtrend to an uptrend. It’s like the market is transitioning from one mood to another.
Double Top and Double Bottom
The double top is like spotting two mountain peaks at roughly the same height. It usually forms after a strong rise in price and suggests a reversal from an uptrend to a downtrend. It’s as if the market tries to surpass a high point twice but lacks the strength to do so, indicating a shift in momentum.
The double bottom, on the other hand, is like seeing two valleys. It appears after a significant decline and hints at a shift from a downtrend to an uptrend. Think of it as the market testing a low point twice and deciding it’s time to move upwards.
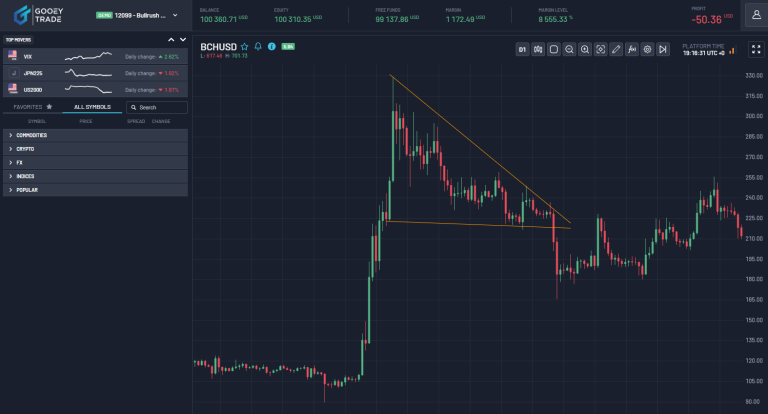
Triangles
Triangles come in three varieties: ascending, descending, and symmetrical. Picture an ascending triangle with a flat top and an upward-sloping bottom. This pattern usually forms during an uptrend and suggests continuation. The descending triangle is its mirror image, indicating a continuation of a downtrend.
The symmetrical triangle, where two converging trendlines enclose the price, signals that a breakout is imminent. However, the direction depends on the prevailing market trends and other indicators. It’s like the market is in a state of indecision, building tension for a big move.
Flags and Pennants
Flags and pennants closely resemble each other, both indicating brief pauses after a significant price movement before continuing in the same direction. A flag looks like a small rectangle tilted against the prevailing trend direction, while a pennant is more triangular. These patterns suggest that the market is taking a breather before resuming its prior trend.
Cup and Handle
The cup and handle pattern resembles a tea cup on a chart, consisting of a rounded bottom and a slight downward drift on the right side (the handle). It’s typically seen as a bullish continuation signal, indicating that after a period of consolidation and a slight pullback (the handle), the price is likely to break out and continue upward.
The Language of Patterns
Understanding these patterns is like having a deeper conversation with the market. Each pattern tells a story of struggle between buyers and sellers, of momentum gathering for a breakout, or of a trend running out of steam and ready to reverse. It’s important to note, however, that while these patterns can provide valuable insights, they’re not infallible. They should be used in conjunction with other forms of analysis, including technical indicators and fundamental analysis, to make more informed trading decisions.
In the high-stakes environment of a trading contest, recognizing and interpreting these patterns quickly can be a significant advantage. But like any skill, it requires practice and a keen eye for detail. With time, these patterns can become familiar landmarks in the ever-changing landscape of the markets, guiding your trading decisions and helping to navigate towards potential profits.
Join BullRush News:
Using Technical Indicators
In the world of trading—where deciphering the market’s next move is akin to solving a complex puzzle—technical indicators serve as essential tools. They help traders forecast future price movements based on past and current price action and volume. Let’s explore some of the most utilized technical indicators like Moving Averages, RSI (Relative Strength Index), and MACD (Moving Average Convergence Divergence), and uncover what they reveal about the market.
Moving Averages
Imagine you’re smoothing out the wrinkles on a bedsheet to see the general shape of the bed beneath. That’s akin to what Moving Averages (MAs) do with price data. By averaging the price over a specific period, MAs help identify the direction of the trend. The two most common types are:
Simple Moving Average (SMA): Calculates the average price over a specific number of days, giving equal weight to all prices.
Exponential Moving Average (EMA): Similar to SMA but gives more weight to recent prices, making it more responsive to new information.
When the price moves above the MA, it might indicate the start of an uptrend; when it moves below, a downtrend could be beginning. Traders often watch for crossovers between short-term and long-term MAs as signals for potential market turns.
Relative Strength Index (RSI)
Now, imagine you’re trying to gauge the enthusiasm of a crowd. If people are overly excited, it might be a sign the party’s about to calm down. Conversely, if there’s a lack of enthusiasm, things might pick up soon. The RSI measures the speed and change of price movements to indicate whether a security is overbought or oversold. It ranges from 0 to 100, with high levels (typically above 70) suggesting a security may be overbought (and possibly due for a decline), while low levels (below 30) indicate an oversold condition (potentially ready for an increase).
Moving Average Convergence Divergence (MACD)
Imagine you’re watching two runners (let’s call them Shorty and Longy) racing around a track at different speeds. Sometimes they come close together, other times they drift apart. This dynamic is similar to how the MACD works. It consists of two moving averages that help identify trend direction, momentum, and potential reversals.
The MACD line is the difference between two EMAs (usually the 12-period EMA minus the 26-period EMA).
The signal line is typically a 9-period EMA of the MACD line.
A key moment is the “crossover,” when the MACD line crosses above (a bullish signal) or below (a bearish signal) the signal line. Divergence occurs when the MACD direction differs from the price trend, hinting at potential reversals.
Interpreting the Indicators
These indicators are like the instruments in an airplane’s cockpit, providing crucial information to navigate the markets. Moving Averages offer a bird’s-eye view of the trend’s direction. The RSI acts like a thermometer, measuring the market’s fever pitch of buying or selling. MACD serves as a radar, detecting shifts in momentum before they become visible as trend changes on the chart.
But just as a pilot must consider weather, terrain, and air traffic, traders should use these indicators in conjunction with other tools and analysis methods. No single indicator can provide all the answers; they’re most effective when used together to confirm signals and strategies.
In a competitive scenario like a trading contest, effectively utilizing these indicators can make the difference between flying through turbulence or cruising smoothly to your destination. They illuminate paths through the markets’ constant ebb and flow, guiding traders toward informed and strategic decisions.
If you are interested in Technical Analysis:
Apply Technical Analysis in a Bull Market
Not sure how fundamental analysis is different from technical? Here is a great summary
Managing Emotions and Psychological Factors
Explore strategies to control your emotions and maintain discipline throughout the trading contest.
Practicing Emotional Regulation
In the high-stakes world of trading, mastering your emotions is as crucial as mastering the markets.
Begin with a solid trading plan, laying out your strategies and risk management tactics clearly. This acts as your north star, guiding decisions amidst market volatility.
Mind and Body Focus
Daily mindfulness or meditation can be a game-changer, sharpening focus and calming the mind, enabling you to observe market movements without emotional bias. Regular physical activity, too, plays a pivotal role; it alleviates stress, boosts mental clarity, and keeps you grounded.
Structured breaks throughout your trading day prevent decision fatigue, refreshing your perspective and ensuring you approach each decision with a clear mind.
Embrace emotional awareness; recognizing your emotional triggers allows you to pause and reassess rather than react impulsively. Lean on your support system (fellow traders and mentors) sharing experiences and strategies can provide relief and fresh insights.
Finally, reflect on your trading decisions and emotional responses by keeping a journal. This not only helps in identifying patterns that lead to stress or rash decisions but also in fine-tuning your strategy.
Concentrate on what you can control: your actions and responses, not the market’s every move.
These practices, woven into your daily routine, can significantly enhance your resilience, decision-making, and overall performance in the contest.
Developing a Trading Routine
Start by setting a specific time each day for market analysis, focusing on reviewing economic news, chart patterns, and technical indicators relevant to your trading interests.
Allocate periods for actual trading, ensuring they align with market hours that historically offer the most volatility and liquidity for your chosen instruments.
Incorporate time for education and strategy refinement, dedicating moments to learn from trades executed, new market trends, and adjusting your approach as necessary.
Schedule short, regular breaks to prevent fatigue and maintain focus. End your day with a review session, where you assess performance, journal your trades, and note any emotional triggers or successful strategies.
This routine should be flexible yet structured, allowing you to respond to market changes swiftly while maintaining a disciplined approach to trading.
Balancing market engagement with rest and reflection fosters resilience, sharpens decision-making, and cultivates a sustainable trading practice.
Before You Get Started
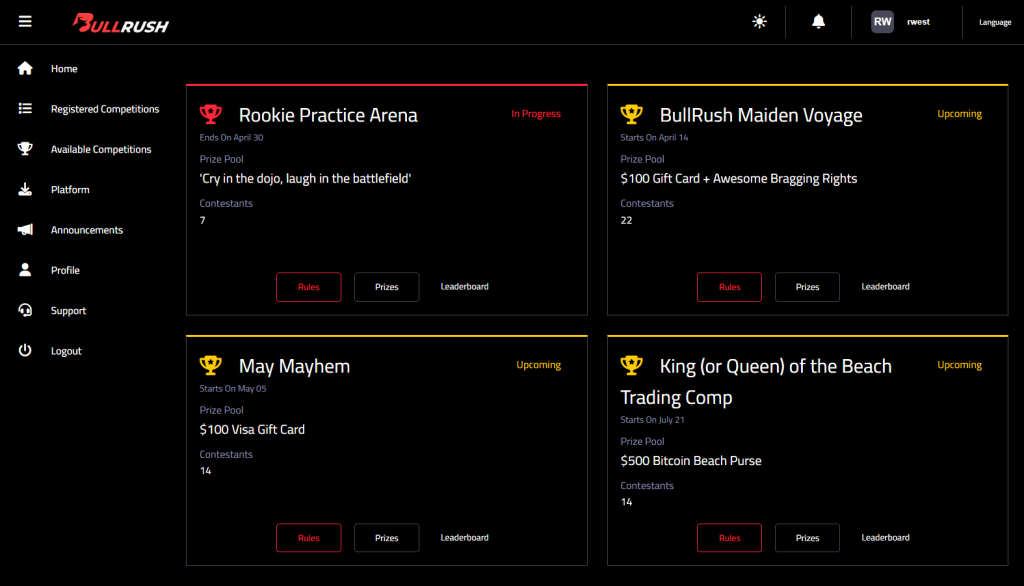
Participating in trading contests can be a rewarding and enriching experience for traders of all levels. Ready to practice your trading skills?
By understanding the rules, setting realistic goals, and developing winning strategies, you can enhance your skills and potentially win exciting prizes.
Utilize the tips and techniques shared in this post to elevate your trading game and excel in the world of trading competitions.
Subscribe to our weekly trading newsletter for more valuable insights, tips, and updates to help you succeed in your trading journey.