
Fibonacci Trading: Improve Your Trading Skills
Table of Contents
Imagine a world where secrets of nature could be applied to predict the future of financial markets. That is exactly what Fibonacci levels promise: a powerful tool traders all over the world use to pinpoint zones of probable support and resistance, foresee further price movement, and raise their chances of success.
These levels are taken from the Fibonacci sequence, a series of numbers in which any number is the sum of the two preceding numbers, as 0, 1, 1, 2, 3, 5, 8, 13, 21…. This naturally occurring sequence forms the basis for some important ratios that traders use to identify probable price reversals or trend continuations.
How does that natural phenomenon translate into the world of finance? The underlying principles behind the Fibonacci sequence can be applied in trading to the price charts, highlighting every support and resistance level, which offers an insight into potential price movements.
But before we explore the practical uses of Fibonacci levels within trading, let’s delve deeper into the origins of this mathematical magic.

The Story of the Golden Ratio
The Fibonacci sequence is a simple yet profound series of numbers named after Leonardo Pisano, a 13th-century Italian mathematician, who is commonly referred to as Fibonacci. Each number in this series is essentially a summation of the previous two originating numbers, which start at 0 and 1:
0, 1, 1, 2, 3, 5, 8, 13, 21, 34, 55, 89.
This deceptively harmless-sounding series actually harbors in itself a forceful secret-the Golden Ratio, sometimes symbolized by the Greek letter phi (Φ). This is roughly the ratio of 1.618, which arises when you divide any number in the Fibonacci series by its preceding number. The deeper one travels along this series, the closer this ratio gets to the Golden Ratio.
The Golden Ratio is a mathematical constant found throughout nature, from the spiral arrangement of sunflower seeds to the proportions of the human body. Even the intricate beauty of seashells, pinecones, and the branching patterns of trees all show its presence. Such pervasiveness indicates an innate relationship between the Fibonacci series and the very laws that rule the universe.

The Fibonacci Spiral: A Visualization of Nature’s Code
Meanwhile, the Fibonacci sequence turns to an even more astonishing pattern-the Fibonacci spiral. Imagine a set of squares that are drawn with the sides corresponding to the Fibonacci numbers. The opposite corners of these squares are then connected by using quarter circles. The resulting curve is known as the Fibonacci spiral, a beautiful illustration of the Golden Ratio in action.
This spiral is ubiquitous in nature, from the spiral arms of spiral galaxies to nautilus shells. What a discovery it is that such diversified forms present the same presence of the Golden Ratio and the core role it plays in the shaping of everything that surrounds us.
Fibonacci in Trading: A Simple Step-by-Step Guide
As we have already mentioned above, Fibonacci numbers, derived from the Fibonacci sequence (0, 1, 1, 2, 3, 5, 8…), hold intriguing power in the world of trading. These numbers have been adapted to create tools that help traders identify potential price reversals and target future price movements. These steps will walk you through the fundamentals of using Fibonacci tools in trading, specifically focusing on Fibonacci retracement levels and extensions. By understanding and applying these concepts, you can gain a deeper understanding of market behavior and make more informed trading decisions.
Step 1: Understanding Fibonacci Retracement Levels
Of the various Fibonacci tools at a trader’s disposal, the most utilized is the Fibonacci Retracement. This tool projects a price wave between a low swing and a high swing-or vice versa-by various levels of Fibonacci retracements. These levels indicate potential areas where price might retrace back, reverse, or continue a trend.
Here are explanations of key Fibonacci retracement levels:
23.6%: The first important retracement area.
38.2%: Stronger retracement point, a more important pause in the price.
50%: Although not technically a Fibonacci number, this is often considered a resistance or support level.
61.8%: Major retracement level; usually larger price reversals happen.
100%: Complete retracement; the price is now back to the level it was earlier.
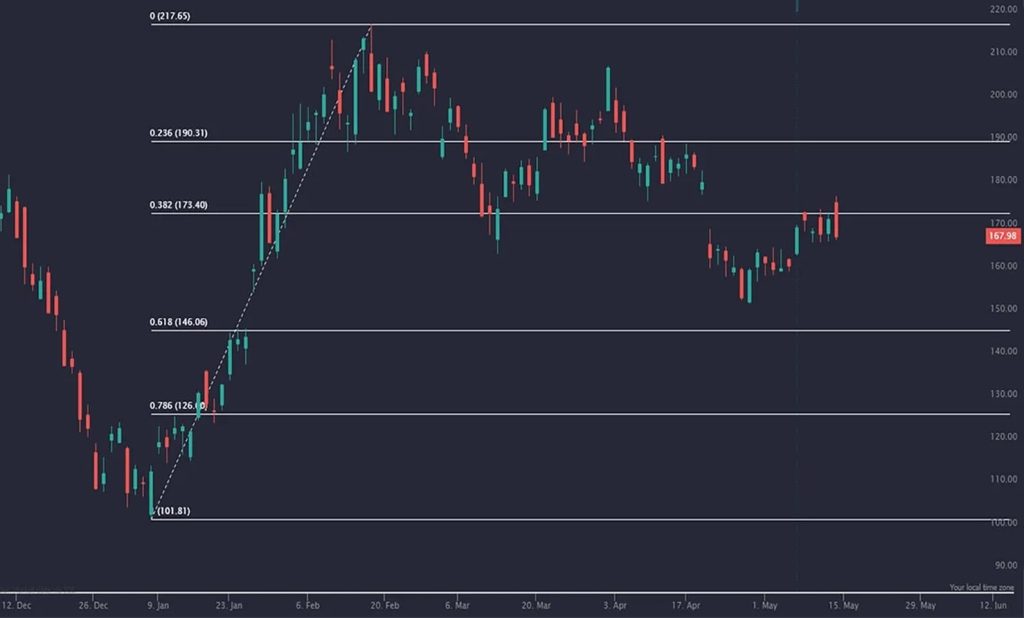
Step 2: Applying Fibonacci Retracement to a Chart
To trade using Fibonacci retracements, follow these basic steps:
- Identify a major high and low in the market-that is, a swing point.
- Draw the Fibonacci retracement tool from low to high for an uptrend or high to low for a downtrend.
- The Fibonacci levels 23.6%, 38.2%, 61.8%, and so on-will appear and highlight potential areas the price may stop or bounce.
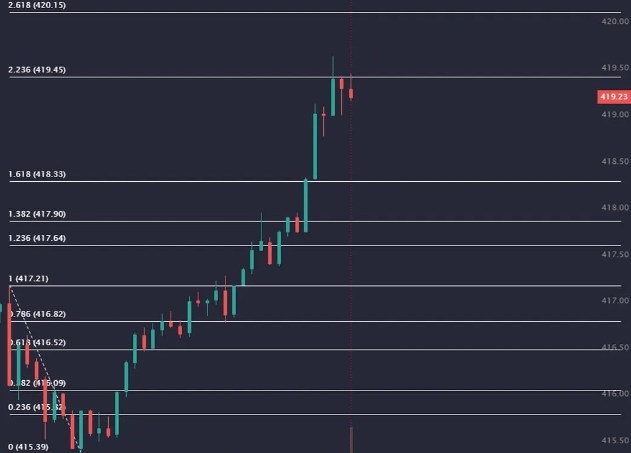
Step 3: Using Fibonacci Extensions for Targeting
Fibonacci extension levels help traders determine the potential price targets outside the initial movement of a trend. While Fibonacci retracement levels predict the potential areas that the price may pull back to, Fibonacci extensions can help to predict how far price may move once the retracement is complete and the trend renews.
Fibonacci extensions are quite useful whenever you are looking at taking profits or setting exit points in a trending market. They can be applied after a retracement to predict the potential areas of resistance or support that may serve as targets for the ongoing move.
Following are some common levels of Fibonacci extension:
127.2%: This is usually the first significant level beyond the 100% retracement. This is considered an eventual target in the case of moderate trend continuations.
161.8%: This is considered the “golden ratio” and is one of the major targets. If a trend is strong, more often than not, this will be a price target where traders will aim.
200%: This is the level that price action has moved two times the range of the first wave. This normally represents a very strong continuation.
261.8% and higher: These are less frequently reached but can be used whenever the trend is particularly strong.
Example of Fibonacci Extensions in Action:
Now, imagine the market moved from 100 to 150 dollars, a 50 dollar move, and then came back to 125 dollars. Applying Fibonacci extensions to this, the tool would estimate some upside targets from the original move:
127.2% extension: The potential target is $163.6
161.8% extension: A stronger target around $175.9
200% extension: A more aggressive target at $200
These levels help traders plan exits with specific mathematically derived targets based on the extension of the original move. Fibonacci extensions work best when used with other tools: trendlines, moving averages, or candlestick patterns.
How to Apply Fibonacci Extension:
- Establish the trend: Make sure you are in the trending market, whether uptrend or downtrend.
- Applying Swing Highs and Lows: Similar to using Fibonacci retracements, you first identify your swing high and your swing low. You apply the Fibonacci extension tool in an uptrend from the swing low to the swing high, then extend it back to the retracement point-where the price started pulling back.
- Projection of Extension Levels: The Fibonacci extension tool extends levels higher than the 100% retracement level for the potential price targets as the trend continues.
- Plan Exits or Targets: You can use the extension levels to set profit targets or where price may meet resistances.
Step 4: Combining Fibonacci with Other Tools
These Fibonacci retracement and extension levels are, as a rule, combined with other types of technical indicators to confirm the price movement and give support to your analysis by either trendlines, candlestick patterns or moving averages. All this helps traders to create a fuller view of the market.
Step 5: Acquiring an Understanding of the Strength and Weaknesses of Fibonacci Levels
Fibonacci levels are powerful for measuring the probable support and resistance areas, yet their weak sides are noteworthy too. Two important considerations that should be taken into account are given below:
- Not a Magic Bullet: While Fibonacci levels really do an excellent job, they are not a guarantee – the market can suddenly change and make those levels less predictable.
- Subjectivity: Since different traders might interpret Fibonacci levels in their own unique way, slight variations in interpretation might give you different signals. You will need to have a pretty clear strategy and additional indicators to support your view.
By following the steps above, you will be able to apply Fibonacci tools in your trading strategies.
The Fibonacci Strategies in Trading Challenges: A Spiraling Road to Trading Success

Improvement and gathering of knowledge are a part of the life of every good trader. Trading challenges have turned out to be an appealing tool through which traders can come together and improve their skills in a testing environment. The challenges in trading vary from details of Fibonacci retracement to the subtlety of candlestick patterns that allow traders to experiment, refine, and finally become confident in their approach.
Traders participating in these challenges often employ a wide range of analysis and strategies, including technical analysis, fundamental analysis, Fibonacci strategies, swing trading etc.
Here’s why trading challenges are such a powerful tool for traders:
- Demo Accounts: Most challenges are performed on demo accounts, whereby traders may try new strategies and techniques without the risk of actual financial losses. This gives room for trying out new ideas and practicing without experiencing any financial losses.
- Level Playing Field: The predefined rules and regulations ensure that fair trading competition is maintained, and thus it should be a level playing field for traders of any level.
- Awards: There are cash prizes, offers of special trading software, and performance bonuses galore for many winners in this regard. These, therefore, have the effect of challenging participants to strive as hard as possible to reach the top.
- Learning and Development: These challenges are learning environments wherein participants are challenged to backtest different strategies, perfecting their approach, which helps them develop valuable insights into the dynamics of markets.
- Network Building: The challenges allow to create trading networks, enable any ideas, insights, or other valuable knowledge sharing between traders and trading strategies.
- Building Confidence: These challenges provide a structured means of building confidence in the use of different trading tools and techniques. These challenges can help traders feel more comfortable and confident with their chosen strategies, whether it be perfecting candlestick patterns or applying Fibonacci ratios to mastery of technical indicators.
By participating in trading challenges, traders will be enabled to perfect their knowledge on various trading approaches, test their trading strategies like Fibonacci, swing or scalping trading in practice, and lastly lastly, become more confident and successful traders.
The Fibonacci Code Unveiled
Fibonacci levels are more than a mathematical curiosity, but rather a look into basic order that underlies everything, from the incredible beauty of nature down to the stark volatility of financial markets.
The trader can open new possibilities and approach the market much better with an understanding of the hidden code at work simply by grasping the roots and uses of Fibonacci levels.
Whether you are an old-hand or a completely new trader, this Fibonacci code will allow its secrets to guide your route to even greater and bigger success in trading, trading competition or trading challenge.
Whether you’re looking to deepen your understanding of Fibonacci numbers or just want to engage in an exciting variation of a prop firm competition, trading contests provide a structured and educational environment for growing your trading skills.
FAQs
What is the Fibonacci sequence in trading?
A series of numbers used for predicting possible price reversals and levels of retracement in trading.
How is Fibonacci retracement used?
This is used by traders in a price chart by plotting Fibonacci ratios to establish support and resistance levels.
What is Fibonacci retracement?
It refers to possible reversal levels derived from Fibonacci ratios, which are normally at 23.6%, 38.2%, 50%, 61.8%, and 100%.
Why is the Fibonacci sequence important in trading?
It helps to identify key levels from which the price is likely to reverse or pull back, thereby, in turn, helping with better timing of a trade.
What is a Fibonacci level?
Price levels calculated using Fibonacci ratios that are used to extend possible reversal points.
How can I incorporate Fibonacci retracement to improve my trading strategy?
Apply the retracement tool to a trending market in order to find probable support or resistance points beforehand before executing trades.
Is Fibonacci retracement successful on all markets?
It finds the best application in trending markets but may be used in any market for determining likely reversal points.
What is the Fibonacci golden ratio in trading?
A 1.618 or its reciprocal at 0.618 ratio, oft times used to locate key price levels where reversals may occur.
Can Fibonacci be used for day trading?
Yes. The day traders sometimes use Fibonacci levels on smaller time frames for short-term price action analysis.


Leave a Reply
You must be logged in to post a comment.