Candlestick Analysis in Trading: Unlock Market Movements
Key Takeaways:
- Candlestick Patterns Show Trend Direction: They indicate whether the market is bullish or bearish.
- Patterns signal reversals: Key patterns include the Doji and Marubozu, assisted to locate changes in trends.
- Combine with Other Tools: Enhance candlestick analysis with support, resistance, and volume for stronger trade decisions.
History of Candlestick Analysis
A candlestick chart is a trader’s tool. In general, the chart was developed in Japan in the 18th century. At first, the method initiated by Munehisa Homma, a rice merchant, was aimed at finding the psychology behind the movements of rice market prices. It was the study of the behavior of the market, put together with the emotional drivers of fear and greed, that helped Homma devise candlestick charting as a means to anticipate prices so that he could undertake profitable trades.
It had remained a confidence in Japan for hundreds of years. The techniques didn’t find their place and appreciation among the Western traders until the late 20th century through the work of Steve Nison. It was his books, especially Japanese Candlestick Charting Techniques, which gave birth to the use of candlesticks among western traders. Today candlesticks have found their place as one of the most modern popular tools in trading.
What is Candlestick Analysis?
It involves analyzing the candlestick patterns on charts to represent potential price movements. A candlestick has a body, consisting of the opening and closing prices over a period, and wicks or shadows that define the high and low for the same period. By size and shape, a trader interprets the market mood: that is, bullish and bearish, in order to make decisions based on it.
The reason candlestick analysis has become so popular is essentially because its pictorial nature of representing price action allows traders to understand in a flash some aspects of market psychology. Also, candlestick formations are more visually appealing and easier to understand, yet at the same time they reveal important information about demand and supply, market psychology as well as likely future price movements.
How to Read Candlestick Charts
Each candlestick will tell you something different about the price movement over a specified period, whether it be the 5-minute candle, the 1-hour candle, or even the daily candle. Here’s how to break down the main components of a candlestick:
- Body: The thick part of the candlestick represents the difference between the opening and the closing prices. If the color of the candle is green, hence the price has closed lower.
- Wicks: These are thin lines appearing to continue away from the body of the candlestick. These are representative of high and low prices attained in that period. The wick at the top becomes the highest price, while the one at the bottom forms the lowest price. A longer wick might indicate much more volatility in price. A smaller wick, however, would show fewer fluctuations within that time frame.
- Opening and closing prices: the open price is where the market begins in that timeframe, and the close is where it closes. The big body of the candlestick would show that there is a big move in the prices, while its small body would represent those points in time when the prices have changed very little.
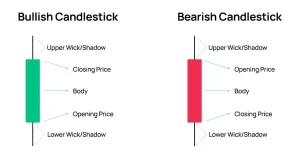
The Candlestick chart graphically shows the psychology of the market and, therefore, is quite well-tailored to meet the needs of traders when attempting to determine the momentum of an asset and predict a market turn.
Some Common Candlestick Patterns and What They Mean
Candlestick patterns help traders gather insight from most probable price movements and market sentiment. These are some of the common candlestick patterns:
Name of the Candlestick | Description | Image |
Marubozu | A candlestick with no wicks. A green marubozu opens at its low and closes at its high, while a red marubozu opens at its high and closes at its low. Indicates a strong trend continuation. |
|
Doji | The opening and closing prices are nearly identical, signaling market indecision or balance between buyers and sellers. | 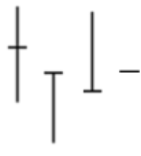 |
Gravestone Doji | The opening and closing prices are near each other at the low of the trading period. Often signals a reversal, especially after an uptrend. | 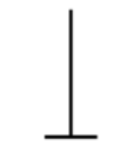 |
Dragonfly Doji | The opening and closing prices are near the high of the period. In an uptrend, this might signal a potential reversal. | 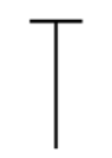 |
Four-Price Doji | The open, close, high, and low are all the same. It signals a moment of complete indecision in the market. | 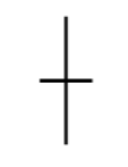 |
Hammer or Shooting Star | A small body with a long lower wick indicates a possible reversal. If it occurs at the top of an uptrend, it’s known as a shooting star. | 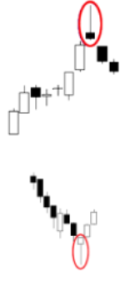 |
Inverted Hammer or Hanging Man | Both patterns have similar structures. The inverted hammer suggests an upward reversal, while the hanging man suggests a downward reversal. | 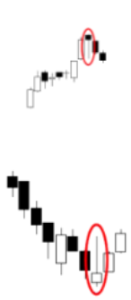 |
Bullish or Bearish Engulfing | A larger candlestick in the opposite direction fully engulfs a smaller candlestick. Bullish engulfing suggests an upward trend, while bearish engulfing signals a downward trend. | 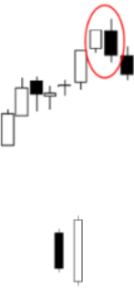 |
Evening Star (Bullish or Bearish) | A bearish candlestick opens below the previous day’s small candlestick and closes within the previous candlestick’s body, signaling buying interruption. | 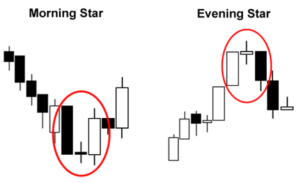 |
Each of them gives a different signal over the future direction of the market and thereby is important to the traders who want to estimate the movement and thereby manage their positions.
Advanced Candlestick Patterns
Besides the basic candlestick patterns, there are advanced candlestick formations that could be of immense help in analyzing market trends and reversals. The following are some of them:
- Three Black Crows and Three White Soldiers: This marks major trends-the first a strong bearish trend, and the second depicts a strong bullish trend.
- Tweezers: These come as two candlesticks with an equal high or an equal low and can form a reversal, more so if there is an extended trend.
- Abandoned Baby: This is a very rare and powerful chart pattern suggestive of a reversal. Observe the gaps amongst candlesticks with a Doji in between, illustrating indecision prior to the big move in one direction.
To get a better understanding of the more advanced candlestick patterns, and how they can work for you, check the BullRush Academy Blog on Candlestick Patterns. It will go deeper into more complex setups and also how to apply them on various time frames and markets.
Candlestick Patterns in Combination with Other Trading Tools
While powerful in itself, the candlestick analysis serves best in relation to other signals for confirmation. The candlestick patterns are combined, for instance, with the following indicators:
- Support and Resistance Levels: These fundamental levels give some indication of where the price might reverse or meet barriers.
- Moving Averages: These smooth out price data and help identify trends and market direction.
- Volume Analysis: The volume of trade coupled with the pattern would give an indication if such a move is strong or not.
If the technical indicators are added together with candlestick analysis, then the trader can have a better trading strategy based on his or her objective of diminishing risk and enhancing chances of success.
Practice and Learn Candlestick Analysis with BullRush
If you are interested in improving candlestick strategies and want some practice experience in trading, try BullRush, a gamified trading platform so you can practice in real-time with less money risk. You’ll have fun during trading competitions and challenges to sharpen up your trading skills. Whether one is a beginner in trading or a well-seasoned trader looking to perfect his strategy, BullRush represents the best opportunity to improve knowledge and skills in candlestick charting and perfection in trading.


