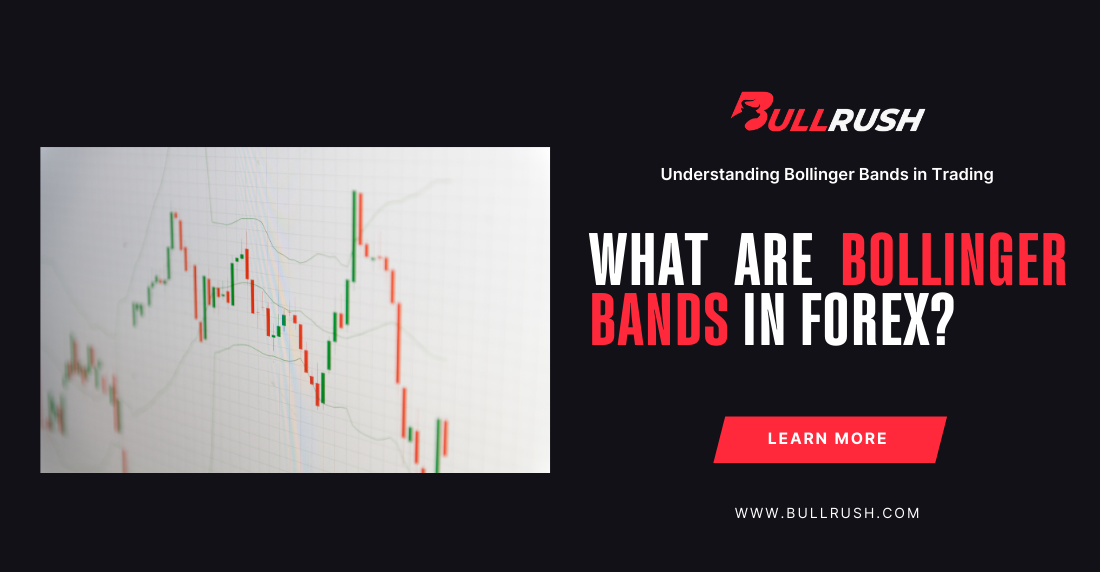
What Are Bollinger Bands in Forex?
Did you know that most major currency breakouts are preceded by silence?
Not chaos. Not breaking news. Just low volatility quietly tightening its grip, like a coiled spring waiting any second to snap.
That silence is precisely where opportunity hides. And if you know how to properly read Bollinger Bands, you can spot those moments long before they turn into explosive moves.
Don’t make any mistakes, Bollinger Bands aren’t just for chart decoration; they’re one of the most useful tools you can have in your box for understanding volatility, spotting potential reversals, and timing entries with confidence. Simply speaking, they can help you see when the market is overextending… and when it’s just getting ready to run.
In this article, we’ll go over what Bollinger Bands are, why they matter in Forex, and how traders of all levels use them to ride trends, catch reversals, and manage risk more intelligently.
Bollinger Bands: Why Do They Matter in Forex?
Think of Bollinger Bands as a market mood ring, designed by John Bollinger: they widen when traders get rowdy and shrink when the market settles down. They’re made up of three lines:
- Middle line: usually a 20-period simple moving average (SMA)
- Upper band: the SMA plus two standard deviations
- Lower band: the SMA minus two standard deviations
These bands stretch and squeeze with every price move, adapting instantly to the market’s shifting rhythm. That real-time responsiveness is what makes them so powerful.
In Forex trading, where currencies can surge or stall in the blink of an eye, Bollinger Bands act like your market radar: revealing explosive moves before they happen and giving out warning signals when momentum is fading.
Are Your Charts Trying to Warn You? Bollinger Bands Might Be
One of the core uses of Bollinger Bands is measuring volatility: how much price is moving over time.
- When the bands squeeze together, it means the market is quiet and volatility is low.
- When the bands expand, it signals high volatility and the potential for larger price swings.
Think of it like this: tight bands = calm before the storm. Once they start to widen again, a strong move is likely coming. This is why many traders look for “Bollinger Squeezes” as part of breakout strategies.
Pro Tip: The tighter the squeeze, the bigger the potential breakout. Make sure to use this as a cue to keep a close eye on the market.
Can a Simple Line Predict When the Market Will Snap Back?
The short answer: not by themselves, but they can give great clues. But only when used right.
- When price touches the upper band, it can signal that the market is overbought.
- When price touches the lower band, it may be oversold.
But here’s the catch: in strong trends, price can “ride” the bands for quite some time. This is known as a band walk, and it’s a signal to ride the trend, not fight it.
That’s why confirmation is key. Use Bollinger Bands alongside other trading indicators or patterns, such as:
- RSI or MACD divergence
- Support/resistance levels
- Candlestick reversals
With the combined power of these nifty tools, you can spot higher-probability reversals with much more confidence.
What’s the Easiest Bollinger Band Setup to Try Right Now?
Here’s a simple setup to try if you’re learning to trade reversals:
- Wait for price to touch the lower band during a downtrend.
- Look for a bullish candlestick pattern (like a hammer or engulfing candle).
- Check if RSI is showing oversold conditions.
- Enter long with a stop just below the recent low.
- Take profit at the middle band or upper band.
As a matter of fact, you can reverse this logic for short trades at the upper band.
🔍 Want to test this out? BullRush offers free trading competitions where you can practice with real-time charts.


