
What Is RSI? How to Use Relative Strength Index
Your eyes are fixed on the screen, staring at a chart. The price is climbing. You’re wondering… Is this the start of a breakout, or the beginning of a reversal?
That’s where RSI comes in.
Short for Relative Strength Index, RSI is one of the most trusted tools traders have in their toolbox and break out when they are doing a market analysis and they want to sense when a move is running out of steam. It can determine whether price has climbed too high, too quickly, or dropped too far, too fast, giving hints that a pullback or reversal could be just around the corner.
But let’s get one thing clear: it’s not a crystal ball. It can’t and won’t predict the future.
But when used right, RSI becomes a sharp signal flare, lighting up potential overbought or oversold zones, flagging trend fatigue, or backing up a breakout with confidence. Pretty useful if you ask us… and we’ll show you why.
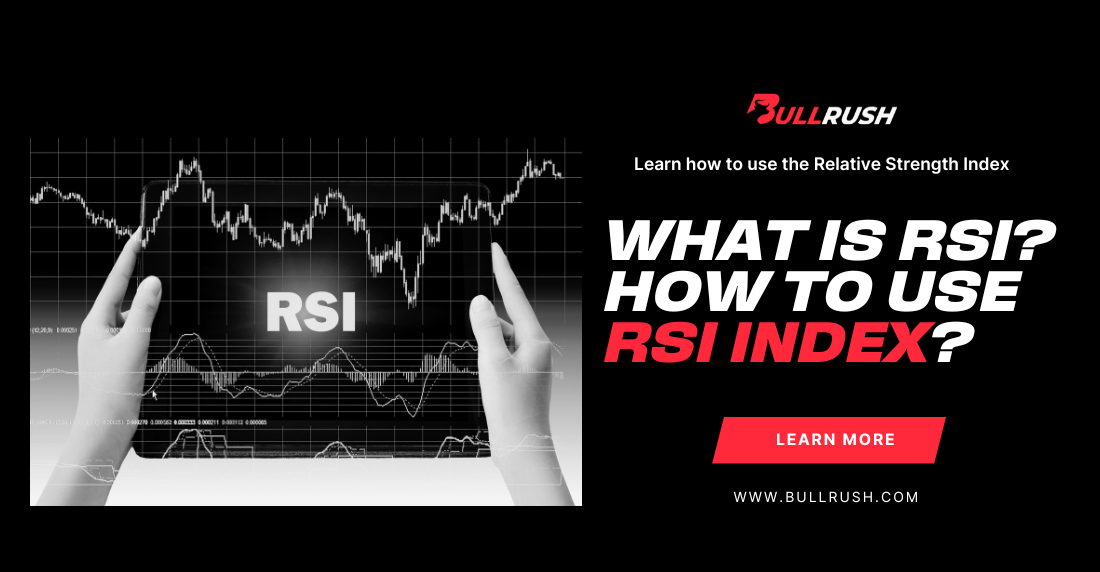
What Is RSI (Relative Strength Index)?
RSI stands for Relative Strength Index, a momentum oscillator developed by J. Welles Wilder back in the late 1970s. Wilder designed it with the idea to measure the speed and change of price movements.
It’s plotted as a line on a scale from 0 to 100. But here’s the key:
- Above 70 = Overbought
- Below 30 = Oversold
It doesn’t mean price must reverse, but it often signals that the current move is losing steam.
Think of RSI like a speedometer for price. If it’s pushing 80 or 20, the engine is revving. That doesn’t mean the car will crash, but it might slow down or change direction.
✅ Quick Recap:
- RSI ranges from 0 to 100.
- Common threshold levels: 70 (overbought) and 30 (oversold).
- It measures momentum, not just direction.
How RSI Is Calculated (Without the Math Headache)
If you’re not a math nerd, don’t worry, you don’t need to memorize the formula to use RSI effectively. But here’s the gist:
RSI compares the average gains and losses over a set period (usually 14 candles) to determine if the price has been moving up stronger than down (or vice versa).
If the price has had mostly gains in recent periods, RSI rises. If losses dominate, RSI falls. It’s not about how far the price has moved; it’s about the strength of the push.
✅ Quick Recap:
- RSI looks at recent gains vs. losses over a set number of periods.
- It’s typically set to 14 periods by default.
- No need to calculate manually; your charting platform does it for you.
How Traders Use RSI in Setups
You’ve got the gist of RSI, but how do you actually use it when trading?
Let’s look at some of the most common (and useful) strategies:
1. Spotting Reversals (Overbought & Oversold)
One of the most well-known RSI signals is when the indicator crosses into overbought (above 70) or oversold (below 30) territory.
Imagine USD/JPY has been surging all morning. RSI hits 78. You pause. Instead of jumping in late, you wait for signs of slowing. A bearish candle forms. RSI ticks down. That’s your cue.
Just like that, RSI helps you not chase the top.
Pro Tip: Overbought ≠ automatic sell. Oversold ≠ guaranteed bounce. Always make sure to confirm with price action.
✅ RSI Reversal Checklist:
- RSI crosses 70 or 30
- You see divergence (price makes new high, RSI doesn’t)
- A reversal pattern appears (like a double top or pin bar)
2. Trend Confirmation
RSI isn’t just for reversals; it can validate trend strength, too.
Let’s say you’re riding a long trend in EUR/USD. RSI stays between 40–60 the whole way. That’s what we would consider a healthy, stable trend. But if RSI suddenly spikes above 70 and stalls, it might be time to protect profits.
In strong uptrends, RSI often “respects” a floor around 40. In strong downtrends, it holds below 60. This concept is called RSI bull/bear range.
✅ Trend Clarity with RSI:
- In uptrends: RSI stays above 40
- In downtrends: RSI stays below 60
- Range shifts can signal trend reversals
3. Spotting Divergence
This is where RSI becomes a sniper tool.
Divergence happens when price and RSI disagree. For example:
- Price makes a higher high, but RSI makes a lower high → bearish divergence.
- Price makes a lower low, but RSI makes a higher low → bullish divergence.
Keep in mind, divergence is one of the earliest clues that momentum is fading, and a reversal might be brewing.
✅ Divergence Checklist:
- Price hits new high/low
- RSI fails to confirm with a new high/low
- Combine with candlestick patterns for confirmation
Common RSI Mistakes to Avoid
Even though RSI is quite a powerful tool, it’s easy to misuse, especially for beginners. So, make sure to watch out for:
- Taking every overbought/oversold signal as gospel
Just because RSI hits 80 doesn’t mean the trend is over. In strong trends, RSI can stay extreme for a while.
- Trading RSI without context
RSI alone is not a trading strategy. Use it with support/resistance, price action, or other confluence tools.
- Ignoring the higher timeframes
RSI signals on 1-minute charts are noisy. Instead, use higher timeframes (1H, 4H, Daily) for more reliable reads.
✅ Avoid RSI Traps:
- Don’t trade RSI in isolation
- Confirm with market structure
- Respect the overall trend
Learn to Read Momentum the Right Way
Now that you’ve got RS explained, you know it’s more than just an overbought/oversold signal; it’s a window into momentum, trend strength, and potential reversals. But knowing the tool is just the first step.
At BullRush Academy, we go beyond theory. We teach traders how to combine trading indicators like RSI with real-world conditions, market structure, and rock-solid discipline. Because success doesn’t come from knowing when RSI hits 70, it comes from knowing what to do when it does.
Whether you’re training for your next BullRush trading challenge or sharpening your strategies in a trading simulator, we are your go-to platform.
Train like a trader. Think like a pro. Compete like a Bull.
Join BullRush today!